Using the Serial Monitor Effectively
One of the most useful tools available to us, right there in the Arduino IDE is the serial monitor.
You may have already used this for printing the results of sensor readings, but we can also use this to print any variable we need to understand what is happening inside our program during execution time, when our program isn’t doing what we are expecting it to do.
If you have not yet used the serial monitor, all we need to make it work is,
Serial.begin(9600);
In our setup() function. Then we can open the serial monitor and make sure the baud rate matches the value we passed to Serial.begin(). Test it by making sure we can print a message using Serial.print(“Print Message”); or Serial.println(“Print Message and Start a New Line”);
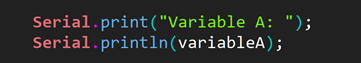
To use the serial monitor for debugging, we will enter into our code, Serial.print() functions with the name or identifier of a variable we wish to track followed by the variable. Using serial prints, we can track multiple different variables through the execution of a program. It gives us a way of looking into our program and tracking in real time how variables are being used and manipulated.
This is really useful for keeping track of a variable that we think may be going out of bounds, making sure an algorithm we have written is doing what we think it is, and it lets us compare maths happening in the execution time with a calculator or Excel manually. I cannot count the number of times I have found; errors in my code, mistakes in a maths function I had written, or problems with my underlying assumptions of how something is working, using this technique.
Another way we can use the serial monitor to help us out, is when our program execution is returning error codes like “exception unhandled” in the serial monitor, or the program seems to be hanging up at a certain point, or getting stuck in a loop somewhere, or even just totally rebooting and resetting the microcontroller when it reaches a certain line.
If our code execution is happening very quickly, it may be difficult to work out the specific line our program is failing at. In this situation I will start writing messages to myself using the serial monitor.
First I identify the last line that I can be reasonably sure is executing before the failure, e.g. if I have a program with an OLED screen, and the screen is booting up, showing my splash screen but then failing before printing sensor values, I can be reasonably sure the program is making it past the OLED_setup(), I might make the assumption that the fault is happening around about the time I am printing the sensor values to the OLED so I will put a line like this:

Somewhere around that point, then compile and re-run my program.
Now if my message gets printed, I know that the execution is at least making it this far into my code. In this case I move this line forwards, slowly line by line until it fails to print on execution. Likewise, if it does not print, I move it backwards line by line until it does print. Either way, after doing this we will have identified the specific line that was stopping the rest of the code execution. Then we can work on understanding why this line is causing a problem.
Likely Causes:
Generally, in the case of “panic” errors or “Exception Unhandled” it will be the result of trying to read from a byte of memory outside of a declared array. If it’s a loop the program is getting stuck in, it’s because we have not added a robust way for the program to exit the loop, or a variable is not changing in a way that is expected. If this may be the case, we can use the technique above to track the variable, and change our code to ensure every loop has an exit clause.
sprintf() functions with incorrect variable flags can also cause a program to stall and fail outright on a single line.
What about tracking how many loops our code is going through? There has been occasions where this has been useful. In this case I add an accumulator variable, print it, then increment it on each loop:
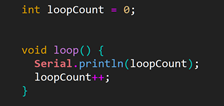
Using this method, we may see some pattern, like the program stalling on a specific number of loops through, or a variable going out of bounds on a regular interval.
Fantastic Fault Codes and How to Fix Them
Possibly the first type of errors we will experience when we start writing code are compiler errors. These are faults with our syntax, code structure, undeclared variables or a myriad of different errors that cause the IDE to fail compiling, and return a number of different error codes and messages, that can seem really daunting to understand at first.
The first step is to turn on verbose output in the IDE settings. This will ensure we are getting the full list of warnings and errors from the compiler, which will help us track down bugs faster.
First open the Arduino IDE, navigate to File, then Preferences.
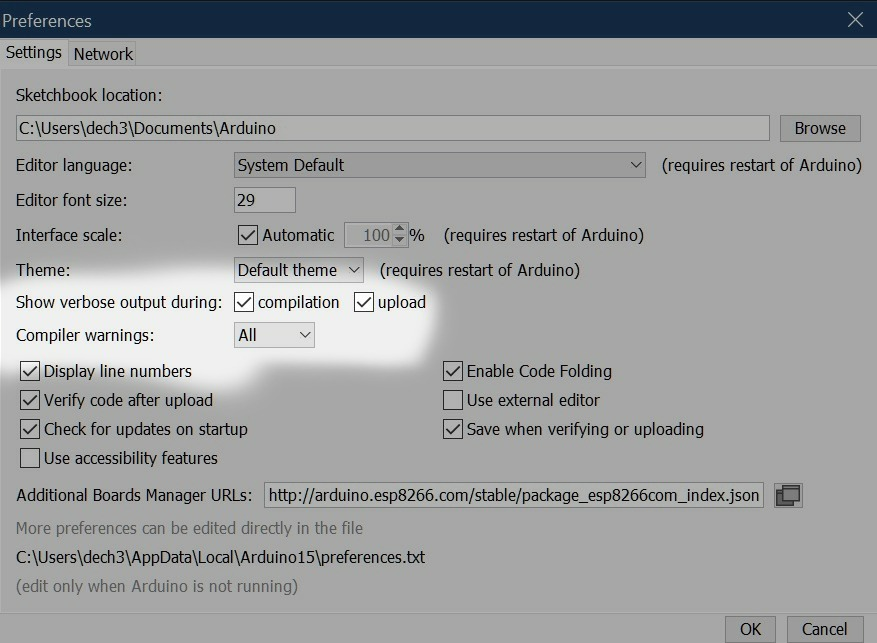
We want to make sure Show verbose output during: compilation and upload
are ticked. We can also change Compiler warnings to all. I also prefer having Display line numbers, and Enable Code Folding ticked.
— Information on fault codes coming soon —
Other Software Debugging Methods
What other tools or methods are useful for debugging at the software level?
Writing Pseudo Code
Pseudo code can be as simple as writing down, step by step what we want each line of code to do. Even if we are struggling with the specific syntax, pseudo code lets us evaluate whether our logical progression makes sense. It can also highlight areas where we think our code should do X, but on review, we can see we are doing Y.
Here is some psuedo code for flashing an LED:
setup{
set led pin as output
}
loop{
if, currentTime – previousTime is greater than delayTime
if ledState is HIGH,
turn LED pin low:
else
turn LED pin HIGH;\
record currentTime in previousTime variable
}
This may seem painfully simple for this example, and feel like a needless doubling of work, but as our programs get more complex, writing out this list of instructions, without worrying about syntax or language, can help us come to a deeper understanding of what we are asking our program to do, and how the code we write, relates to what we are attempting to do. This can be done before writing any code whatsoever.
If our program is already written, We should be able to write down, step by step what each line of our code is doing. If we come across a line that we do not quite understand, we can use it as an opportunity to research more about the specific framework or function we are trying to implement. We shouldn’t worry if we cannot find out exactly, or do not quite understand, we can write down our best estimation, or even (I have definitely done this) “//This line works, I don’t know why“, then, when we are reading back we know this is a gap in our knowledge which we can fill at some point. The act of going through and writing out what each line is doing is one of THE BEST learning tools.
Check Inputs & Outputs of Functions
If our code is arranged into functions (see lesson one) then it should be easy to trace faults back to specific functions. What are our inputs into a function? Are these within the range we expect and can we check they are correct?
What are the outputs from the function? Are they within expected ranges and can we check if these are correct?
Once we have identified the variable that isn’t within the ranges we expect, it should be easier to find the problem and solve it.
Identifying if it is an input or an output to a function shows us whether the problem is happening inside our function, or before it. This is another big advantage of breaking our program into individual functions.
Commenting Out Misbehaving Code or Functions
If unexpected behaviour is occurring, we can comment out all the functions not directly involved with the steps we are debugging. We can then call our functions, even inputting known values to make sure the output in the range of what was expected. Once we are happy that our output matches our expectations, we can start uncommenting calls to other functions one by one, and checking that each of them performs in the expected manner.
Conclusion on Software Debugging
Following these processes should make it possible to debug almost any program step by step. Eventually we may run into a function that we simply cannot get to perform as we expect it to, but now if we need to find a fix, we can search for solutions with much more precision. We can ask people for advice about a specific step in our larger program, rather than posting our entire code with a single question, “why does this not work?”
Debugging Hardware
So we are pretty sure our code is working, we have verified our functions are performing correctly, printed out expected output values to the serial monitor, and everything seems to be correct, but our project still isn’t working, I guess it’s time for hardware debugging.
Most hardware debugging at the lower levels is just check, and recheck, and check again every connection. I have sometimes spent days looking at a PCB to find a small wiring mistake on them. You just cannot beat a good eye and attention to detail.
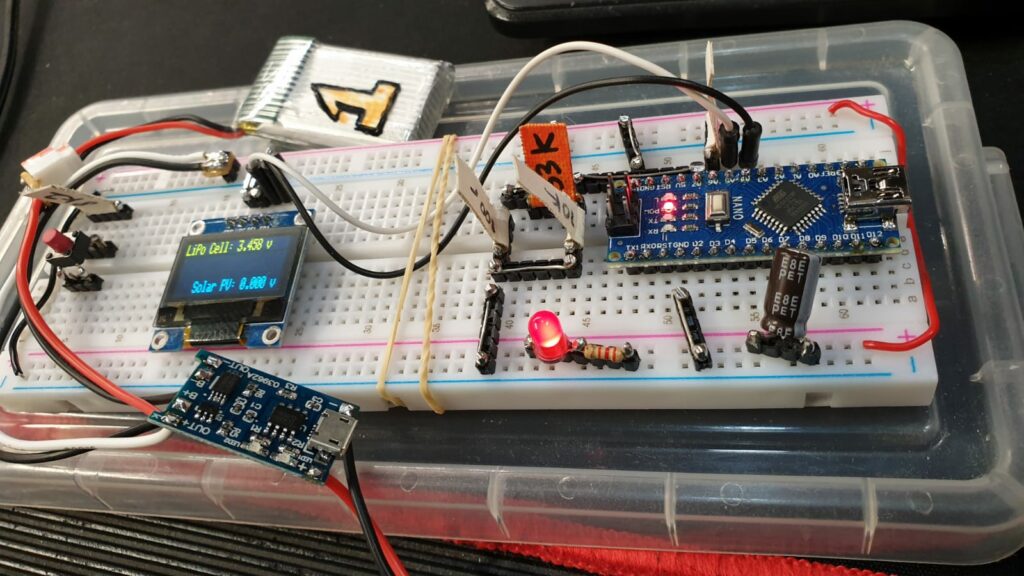
If you are using breadboards for temporary connections be warned, they can suck! Try and avoid using the thin cheap wires that don’t sit snugly into the sockets, and be prepared to do extra debugging and wiggling wires around if something is not working well on breadboard. Personally, I try to replace as many of the loose prototyping leads with header pin jumpers I have soldered myself to use with breadboard.
This cuts down the number of long wires required, and makes breadboard circuits reliable enough to move around without breaking.
In no particular order these are some of the steps we could undertake when debugging hardware:
- Check the power supply. Make sure that 5v or 3.3v is where we expect it to be, make sure GND connects to GND where we expect it. We will need a multimeter to do this. I would estimate 60-80% of hardware issues come down to a power issue, either power not getting where its needed, or missing ground connections.
- Check for wires shorting. Especially if we have soldered our own protoboard. It does not take much for some thin bit of solder to bridge the gap between tracks. Ensure we haven’t used too much solder. If necessary, remove some and run a knife between each track to clean out the gap. Frayed wire is an instant no. Just replace the wires if they are frayed!
- If we have soldered our own boards, check for dry joints. Especially multi pin ICs, sometimes they can look soldered, but the joint underneath is dry. If in doubt, just run over each joint again with an iron, let it melt and reflow itself around the join.
- Learn how components function and how to identify them. Learn their schematic symbols and how to transfer a circuit from schematic to your project. When I am checking a circuit against a schematic, I start at a known location on both the physical circuit, and the schematic, and trace along, highlighting the schematic as I confirm each join against the physical circuit.
- Isolate parts of the circuit. Debug each part on its own before putting a system together, trying to debug multiple problems simultaneously makes the job exponentially harder. Isolate problems, solve individually then put it back together step by step.
- Check for components or wires that are getting hot, this could be a part of the circuit drawing more current than expected, which could indicate short, or somewhere that requires some current limiting resistors. This could also be a sign that our implementation is incorrect and we are drawing far too much power for the wires or power supply we are using. Pay special attention to this with projects that include motors, servos, and Neopixels! One of my recent projects ended up drawing over 8 Amps through wires I had not specified for this kind of current!
- Watch for magic smoke! If the magic smoke escapes a component, we can assume it is toasted and will need to be replaced (although I have been lucky a few times and found enough to the smoke remained inside an IC for it to continue to function). Use your nose, if you didn’t see the smoke escape, but you can smell that toasted electronics smell, you can often identify the specific failed component by finding where the toasted smell is strongest on a PCB. Look for discolouration around components and on wires.
This is just a start at some ways we can start debugging both software and hardware, if you have any other suggestions, queries or comments, feel free to add a comment below.